Finding structure in the noise: Complexity & visual attention
Background
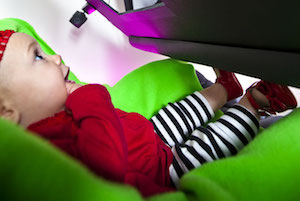
An infant sits in daycare when she hears her mother’s voice. She immediately stops playing with her blocks, and a flurry of coordinated attention processes begin to coordinate in her brain. She must disengage from the enticing blocks, and search for her mother amidst a room filled with competing distractors. This seemingly simple behavior requires the recruitment – and the coordination of – multiple developing attention processes.
Coordination is the organization of different parts of a complex system that enable them to effectively work together. Coordination is essential to cognition but has been relatively understudied (Van Orden, et al., 2011). Research on attention is no exception. While we have a clear picture of the developmental timeline of each sub-component of attention, little is known about how these processes become coordinated.
My work
I fill this gap by applying methods from Complexity Science to study infant attention. Complexity Science is concerned with quantifying the dynamics of complex systems composed of multiple interacting parts.
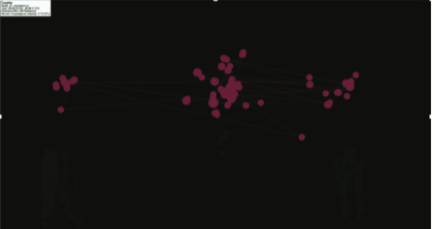
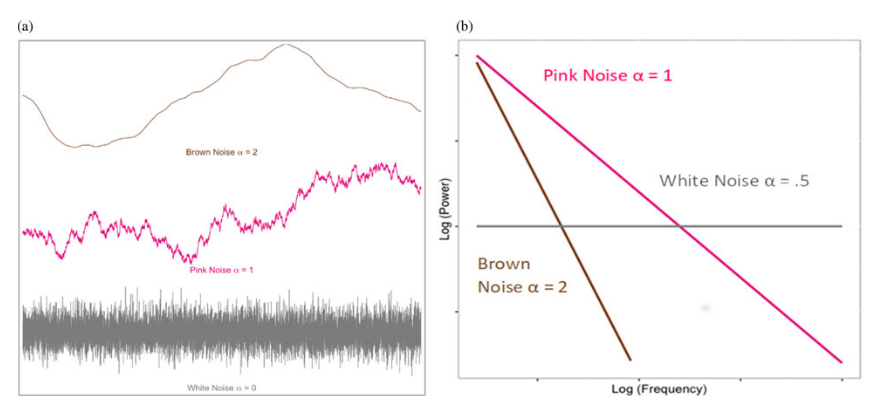
I measure the overall complexity and coordination of infants’ attention by quantifying the fractality of their eye-gaze. Fractality refers to nested patterns of variability that are apparent across multiple measurement scales, resulting in a self-similarity over time (Van Orden et al., 2011). Fractal organization is a critical feature of healthy cognitive and psychobiological systems. It is thought to reflect coordinated systems that are highly self-organized, yet also flexible to change.
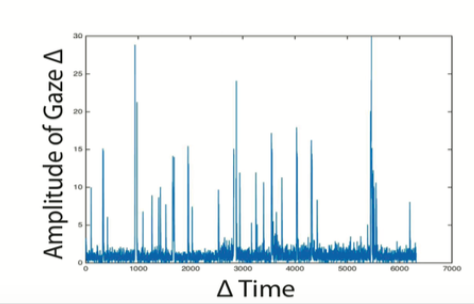
This approach leverages eye-tracking time series data to measure eye-gaze fractality as a proxy for attention coordination. Research with adults has shown that they are faster to find target objects when their eye-gaze shows these fractal signatures, suggesting that flexible coordination between attention sub-processes is critical for efficient visual exploration (Aks et al., 2002).
The experiment
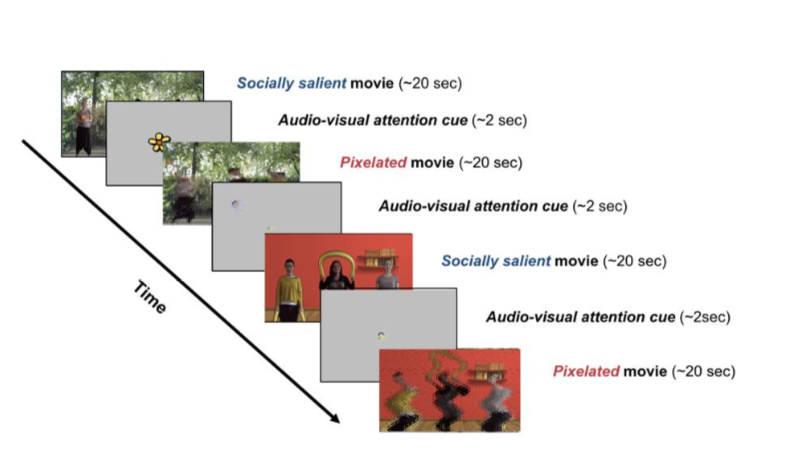
We had infants come to the lab, and watch a series of movies:
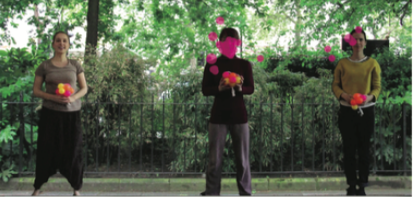
- Social movies: Videos of ladies dancing with toys. Babies love these movies.
- Pixelated movies: These were the same as the social movies, except that the dancing ladies were pixelated. The idea here is that we wanted to preserve a lot of the low-level visual information, but remove most of the socially-engaging information.
- Attention Cues: Throughout the experiment, we show babies attention cues to make sure that they are still calibrated to the eye-tracker. We decided to also measure their eye-gaze fractality during these trials as a “baseline” (e.g. how well coordinated is attention when there a simplistic shape on the screen?).
We predicted that:
- As babies got older, their eye-gaze would become increasingly fractal, indexing their increasingly coordinated attention abilities.
- Babies’ eye-gaze would be more fractal during the social movies, when they would be more engaged/attentive.
- Babies’ eye-gaze should also change on a moment-by-moment basis - they should be more fractal when they were paying attention to important information.
What did we find?
Find out more
For more information on this project, please check out my github.
Here you'll find nitty-gritty information on how I:
- Created time series from 300 Hz eye-tracking data.
- Used Multifractal Detrended Fluctuation Analysis to calculate the fractality of each time series.
- Built statistical model of how babies’ attention becomes more coordinated during the first years of life.
(Here's a sneak peak).